
文件:Sauerstoffgehalt-1000mj2.png

Nguòng-dā̤ gì ùng-giông (2,000 × 1,409 chiông-só, ùng-giông duâi-nâung: 74 KB,MIME lôi-hìng: image/png)
| Mièu-sŭk |
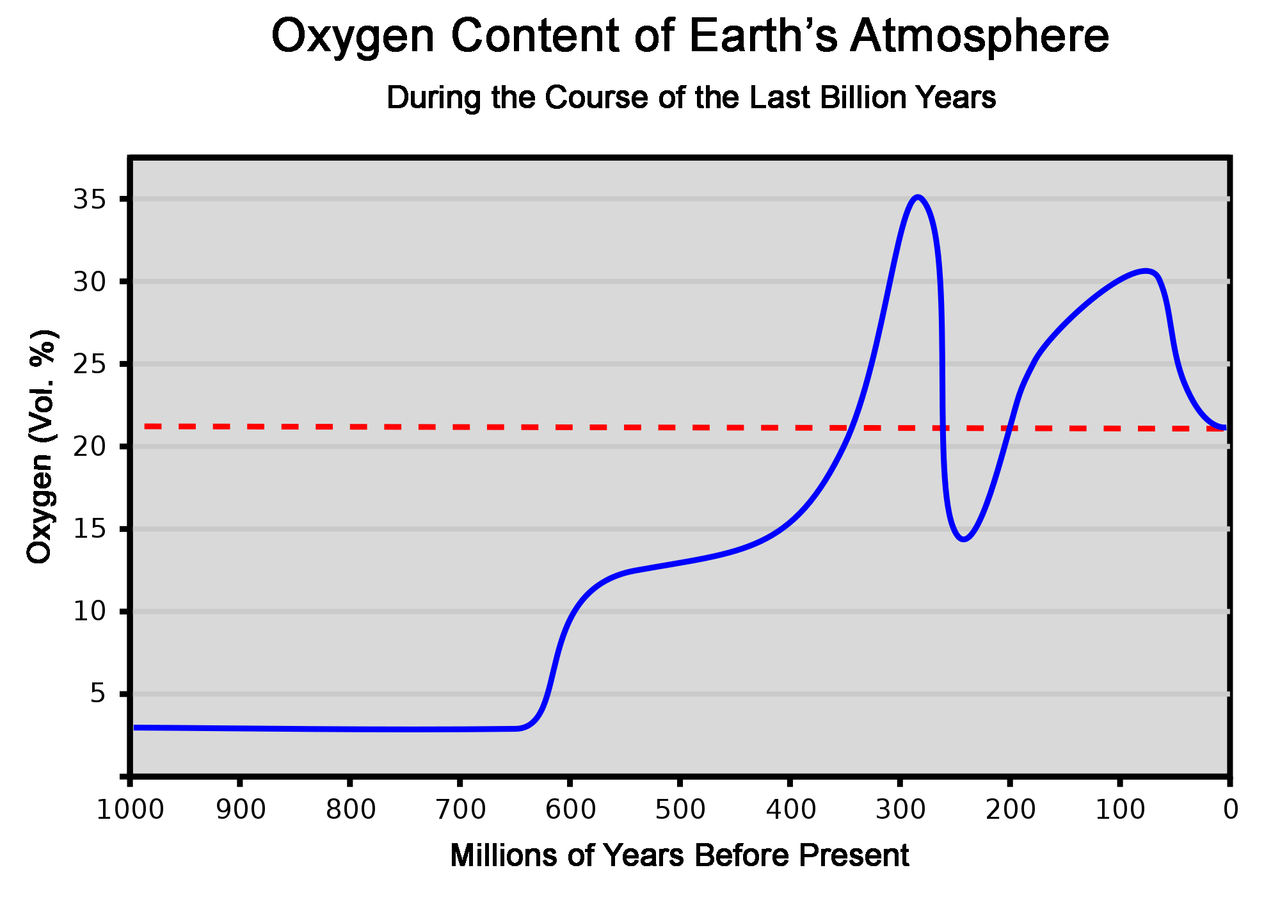
This graph represents the concentration of oxygen in the atmosphere over the last 1000 million years. As a reference, the dashed red line shows the present concentration of 21%. It should be noted that the O2 concentration variation which occurred in past periods can often be estimated only relatively coarsely. Therefore, the chart makes no claim to accuracy, but can only give a broad overview of change at the level of geological periods. This chart is based on the averaged data of several publications. [1][2] Explanation of the curve: After having already begun in the Precambrian, the outgassing of oxygen from the oceans caused atmospheric oxygen to jump from 3% to 12% around the beginning of the Cambrian, because by then all oxygen sinks were finally saturated. Around the same time, the Cambrian explosion took place. During the Silurian and Devonian plants spread over the land, while the animal kingdom was still almost exclusively confined to the water. This caused a further rapid and continuous increase of the oxygen concentration. In the following period carbon burial brought the oxygen level to 35%,[3] thus favoring overgrowth especially in insects. Amphibians and early reptiles were now present on land. Massive volcanic activity at the Permian-Triassic transition caused not only a decline of the oxygen content to 15%, but also the largest mass extinction in geological history. The oxygen concentration then recovered over a long period and reached 26% again by the middle of the Jurassic, and probably even rose to 30% in the Cretaceous. During this time the largest dinosaurs evolved. The end of the Cretaceous period is marked by an impact event, with climate change and a mass extinction. The oxygen level was only 23% 40 million years ago, and had reached the present value of 21% by 25 million years ago. Since then the level has remained constant, apart from fluctuations in the per thousand range. |
| Nĭk-gĭ | (UTC) |
| Lài-nguòng | |
| Cáuk-ciā |
|
| 其他版本 | Derivative works of this file: OxygenLevel-1000ma.svg |
| 這是一張修飾過的圖片,即本圖片是用軟體修改過後的版本,修改的方式或內容有:Translated text to English。原版圖片來源:Sauerstoffgehalt-1000mj.svg。修改者:WolfmanSF。
|
| 我,此作品的版權所有人,釋出此作品至公共領域。此授權條款在全世界均適用。 這可能在某些國家不合法,如果是的話: 我授予任何人有權利使用此作品於任何用途,除受法律約束外,不受任何限制。 |
原始上傳日誌
This image is a derivative work of the following images:
- File:Sauerstoffgehalt-1000mj.svg licensed with PD-self
- 2007-10-27T01:17:42Z LordToran 744x524 (41527 Bytes) '
- 2007-07-23T00:08:15Z LordToran 744x524 (42518 Bytes) == Beschreibung == {{Information |Description=Dieses Diagramm stellt die Sauerstoffkonzentration in der Erdatmosphäre im Lauf der letzten Jahrmilliarde dar. Es ist anzumerken, dass die Zeiträume, in denen vergangene Schwan
- 2007-07-17T23:57:50Z LordToran 744x524 (41203 Bytes) {{Information |Description=Dieses Diagramm stellt die Sauerstoffkonzentration in der Erdatmosphäre im Lauf der letzten Jahrmilliarde dar. |Source=Selbst erstellt |Date=2007-07-18 |Author=[http://de.wikipedia.org/wiki/Benutze
Uploaded with derivativeFX
Ùng-giông lĭk-sṳ̄
Sōng-dĕk siŏh bĭk nĭk-gĭ/sì-găng lì káng hiā sèng-hâiu gì ùng-giông.
| Nĭk-gĭ/Sì-găng | Sáuk-liŏk-dù | Chióh-cháung | Ê̤ṳng-hô | Suók-mìng | |
|---|---|---|---|---|---|
| hiêng-káik-sì | 2010 nièng 3 nguŏk 11 hô̤ (B4) 10:31 | | 2,000 × 1,409(74 KB) | WolfmanSF | {{Information |Description=Dieses Diagramm stellt die Sauerstoffkonzentration in der Erdatmosphäre im Lauf der letzten Jahrmilliarde dar. Als Referenz zeigt die gestrichelte rote Linie die heutige Konzentration von 21% an. Es ist anzumerken, dass die Ze |
Lièng-giék
Â-dā̤ gì hiĕk-miêng lièng gáu ciā ùng-giông:
Cuòng-mĭk ùng-giông sāi-ê̤ṳng cìng-huóng
Â-dā̤ gì gì-tă wiki găk lā̤ sāi cī-bĭh ùng-giông:
- en.wikipedia.org gì sāi-ê̤ṳng cìng-huóng
- fi.wikipedia.org gì sāi-ê̤ṳng cìng-huóng
- ha.wikipedia.org gì sāi-ê̤ṳng cìng-huóng
- hr.wikipedia.org gì sāi-ê̤ṳng cìng-huóng
- ja.wikipedia.org gì sāi-ê̤ṳng cìng-huóng
- mk.wikipedia.org gì sāi-ê̤ṳng cìng-huóng
- no.wikipedia.org gì sāi-ê̤ṳng cìng-huóng
- pt.wikipedia.org gì sāi-ê̤ṳng cìng-huóng
- ru.wikipedia.org gì sāi-ê̤ṳng cìng-huóng
- sh.wikipedia.org gì sāi-ê̤ṳng cìng-huóng
- simple.wikipedia.org gì sāi-ê̤ṳng cìng-huóng
- sk.wikipedia.org gì sāi-ê̤ṳng cìng-huóng
- sr.wikipedia.org gì sāi-ê̤ṳng cìng-huóng
- sv.wikipedia.org gì sāi-ê̤ṳng cìng-huóng
- uk.wikipedia.org gì sāi-ê̤ṳng cìng-huóng
- www.wikidata.org gì sāi-ê̤ṳng cìng-huóng
- zh.wikipedia.org gì sāi-ê̤ṳng cìng-huóng